matplotlib是我們經(jīng)常會用到的一款python繪圖庫,操作簡單��,幾行代碼就能很輕松地畫一些或簡單或復雜地圖形�,線圖、直方圖�、功率譜、條形圖���、錯誤圖���、散點圖以及費笛卡爾坐標圖等都不在話下。今天小編就具體給大家介紹一下matplotlib繪圖教程��。
一��、首先來了解一下matplotlib
1.matplotlib是基于python語言的開源數(shù)據(jù)繪圖包�。matplotlib的對象體系嚴謹而有趣,為我們提供了巨大的發(fā)揮空間�����。在熟悉了核心對象之后��,我們可以輕易的定制圖像����。matplotlib使用numpy進行數(shù)組運算�,并調用一系列其他的python庫來實現(xiàn)硬件交互�。
2.matplotlib安裝
pip install matplotlib
3.Matplotlib導入
import matplotlib.pyplot as plt#為方便簡介為plt
import numpy as np#畫圖過程中會使用numpy
import pandas as pd#畫圖過程中會使用pandas
二、matplotlib繪圖
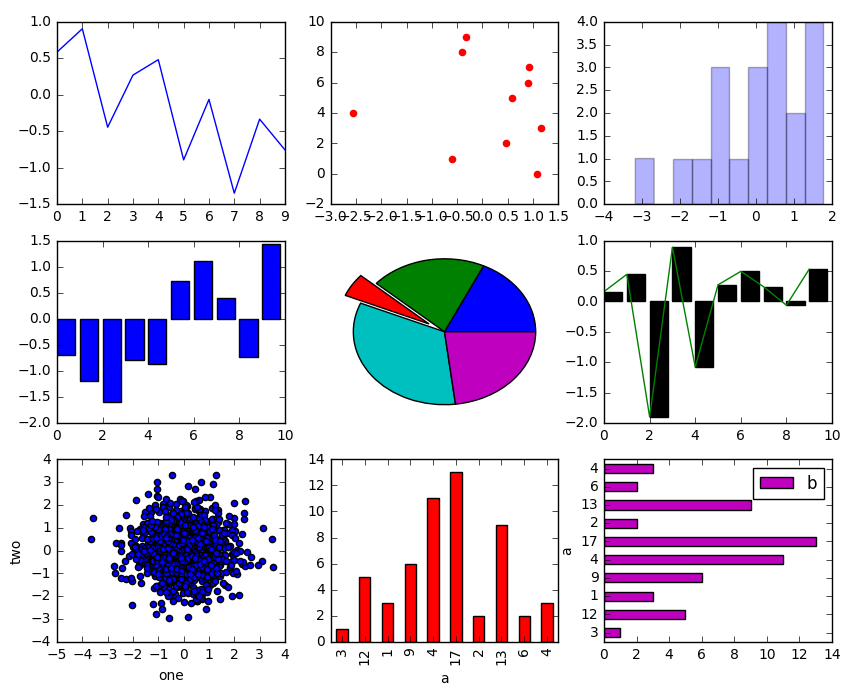
1.柱形圖�,散點圖�,餅狀圖,折線圖
import numpy as np
import pandas as pd
from pandas import Series, DataFrame
import matplotlib.pyplot as plt
%matplotlib inline
fig = plt.figure(figsize=(10,8)) #建立一個大小為10*8的畫板
ax1 = fig.add_subplot(331) #在畫板上添加3*3個畫布�����,位置是第1個
ax2 = fig.add_subplot(3,3,2)
ax3 = fig.add_subplot(3,3,3)
ax4 = fig.add_subplot(334)
ax5 = fig.add_subplot(3,3,5)
ax6 = fig.add_subplot(3,3,6)
ax7 = fig.add_subplot(3,3,7)
ax8 = fig.add_subplot(3,3,8)
ax9 = fig.add_subplot(3,3,9)
ax1.plot(np.random.randn(10))
_ = ax2.scatter(np.random.randn(10),np.arange(10),color='r') #作散點圖
ax3.hist(np.random.randn(20),bins=10,alpha=0.3) #作柱形圖
ax4.bar(np.arange(10),np.random.randn(10)) #做直方圖
ax5.pie(np.random.randint(1,15,5),explode=[0,0,0.2,0,0]) #作餅形圖
x = np.arange(10)
y = np.random.randn(10)
ax6.plot(x,y,color='green')
ax6.bar(x,y,color='k')
data = DataFrame(np.random.randn(1000,10),
columns=['one','two','three','four','five','six','seven','eight','nine','ten'])
data2 = DataFrame(np.random.randint(0,20,(10,2)),columns=['a','b'])
data.plot(x='one',y='two',kind='scatter',ax=ax7) #針對DataFrame的一些作圖
data2.plot(x='a',y='b',kind='bar',ax=ax8,color='red',legend=False)
data2.plot(x='a',y='b',kind='barh',color='m',ax=ax9)
#plt.tight_layout() #避免出現(xiàn)疊影
#plt.show()
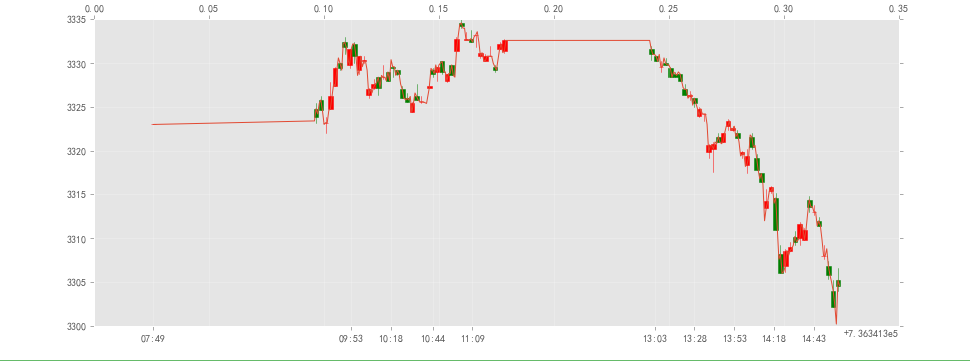
2.蠟燭圖
import numpy as np
import pandas as pd
import matplotlib.pyplot as plt
import matplotlib.finance as mpf
from pandas import Series, DataFrame
from matplotlib.pylab import date2num
%matplotlib inline

plt.rcParams['figure.autolayout'] = True
plt.rcParams['figure.figsize'] = 25,6
plt.rcParams['grid.alpha'] = .4
plt.rcParams['axes.unicode_minus'] = False
plt.rcParams['font.sans-serif'] = ['SimHei']

fig, ax = plt.subplots(1,1,figsize=(12,5))

mpf.candlestick_ohlc(ax=ax,quotes=data2.values[::3],width=.002,colorup='red',colordown='green')
plt.xticks(data2.date[::25],data.date.map(lambda x:x[:5])[::25],rotation=0)
ax.twiny().plot(data3.Open)
plt.tight_layout();
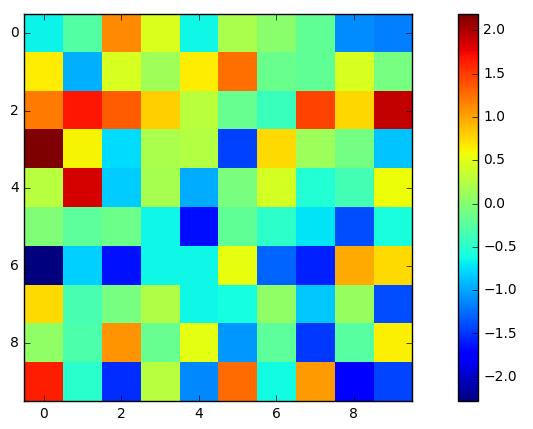
3.熱圖
import numpy as np
import pandas as pd
from pandas import Series, DataFrame
import matplotlib.pyplot as plt
%matplotlib inline
df = DataFrame(np.random.randn(10,10))
fig = plt.figure(figsize=(12,5))
ax = fig.add_subplot(111)
axim = ax.imshow(df.values,interpolation='nearest')#cmap=plt.cm.gray_r, #cmap用來顯示顏色�����,可以另行設置
plt.colorbar(axim)
plt.show()
以上就是小編今天跟大家分享的matplotlib繪圖的一些方法啦�,希望對與大家使用matplotlib有所幫助。
CDA數(shù)據(jù)分析師考試相關入口一覽(建議收藏):
? 想報名CDA認證考試�����,點擊>>>
“CDA報名”
了解CDA考試詳情��;
? 想學習CDA考試教材�����,點擊>>> “CDA教材” 了解CDA考試詳情;
? 想加入CDA考試題庫�,點擊>>> “CDA題庫” 了解CDA考試詳情;
? 想了解CDA考試含金量��,點擊>>> “CDA含金量” 了解CDA考試詳情���;


 京公網(wǎng)安備 11010802034615號
經(jīng)營許可證編號:京B2-20210330
京公網(wǎng)安備 11010802034615號
經(jīng)營許可證編號:京B2-20210330