統(tǒng)計之 - Contingency Table
In statistics, a Contingency Table(also referred to as Cross Tabulationor cross tab) is a type of table in a matrix format that displays the(multivariate) frequency distribution of thecategorical variables.The term contingency table was first used by Karl Pearson in "On the Theoryof Contingency and Its Relation to Association and Normal Correlation",[1]part of the Drapers' Company Research Memoirs Biometric Series I published in1904.
A crucial problem of multivariate statistics is finding(direct-)dependence structure underlying the variables contained inhigh-dimensional contingency tables. If some of the conditional independencesare revealed, then even the storage of the data can be done in a smarter way(see Lauritzen (2002)). In order to do this one can use information theoryconcepts, which gain the information only from the distribution of probability,which can be expressed easily from the contingency table by the relative frequencies.
例子
Suppose that we have two variables, sex (male or female) and handedness(right- or left-handed). Further suppose that 100 individuals are randomlysampled from a very large population as part of a study of sex differences inhandedness. A contingency table can be created to display the numbers ofindividuals who are male and right-handed, male and left-handed, female andright-handed, and female and left-handed. Such a contingency table is shown below.
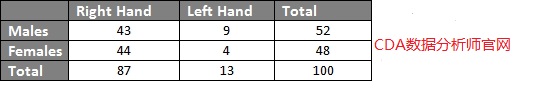
The numbers of the males, females, and right- and left-handedindividuals are called Marginal Totals. The grand total, i.e., the totalnumber of individuals represented in the contingency table, is the number inthe bottom right corner.
The table allows us to see at a glance that the proportionof men who are right-handed is about the same as the proportion of women whoare right-handed although the proportions are not identical. The significanceof the difference between the two proportions can be assessed with a variety ofstatistical tests including Pearson's chi-squared test, the G-test, Fisher'sexact test, and Barnard's test, provided the entries in the table representindividuals randomly sampled from the population about which we want to draw aconclusion. If the proportions of individuals in the different columns varysignificantly between rows (or vice versa), we say that there is a contingencybetween the two variables. In other words, the two variables are notindependent. If there is no contingency, we say that the two variables areindependent.
The example above is the simplest kind of contingency table,a table in which each variable has only two levels; this is called a 2 x 2contingency table. In principle, any number of rows and columns may be used.There may also be more than two variables, but higher order contingency tablesare difficult to represent on paper. The relation between ordinal variables, orbetween ordinal and categorical variables, may also be represented incontingency tables, although such a practice is rare.
CDA數(shù)據(jù)分析師考試相關(guān)入口一覽(建議收藏):
? 想報名CDA認(rèn)證考試,點擊>>>
“CDA報名”
了解CDA考試詳情;
? 想學(xué)習(xí)CDA考試教材�,點擊>>> “CDA教材” 了解CDA考試詳情;
? 想加入CDA考試題庫��,點擊>>> “CDA題庫” 了解CDA考試詳情�����;
? 想了解CDA考試含金量�,點擊>>> “CDA含金量” 了解CDA考試詳情;


 京公網(wǎng)安備 11010802034615號
經(jīng)營許可證編號:京B2-20210330
京公網(wǎng)安備 11010802034615號
經(jīng)營許可證編號:京B2-20210330