利用R語(yǔ)言制作出漂亮的交互數(shù)據(jù)可視化
利用R語(yǔ)言也可以制作出漂亮的交互數(shù)據(jù)可視化����,下面和大家分享一些常用的交互可視化的R包��。
rCharts包
說起R語(yǔ)言的交互包����,第一個(gè)想到的應(yīng)該就是rCharts包。該包直接在R中生成基于D3的Web界面�����。
rCharts包的安裝:
require(devtools)
install_github('rCharts', 'ramnathv')
rCharts函數(shù)就像lattice函數(shù)一樣,通過formula�、data指定數(shù)據(jù)源和繪圖方式,并通過type指定圖表類型�。
下面通過例子來(lái)了解下其工作原理。我們以鳶尾花數(shù)據(jù)集為例���,首先通過name函數(shù)對(duì)列名進(jìn)行重新賦值(去掉單詞間的點(diǎn))����,然后利用rPlot函數(shù)繪制散點(diǎn)圖(type=”point”)�����,并利用顏色進(jìn)行分組(color=”Species”)�。
library(rCharts)
names(iris) = gsub("\\.", "", names(iris))
p1 <- rPlot(SepalLength ~ SepalWidth | Species, data = iris, color = 'Species', type = 'point')
p1
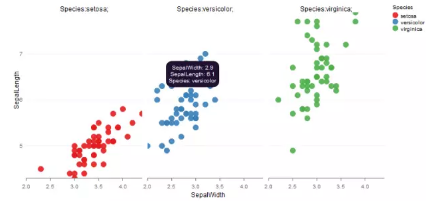
rCharts支持多個(gè)javascript圖表庫(kù),每個(gè)都有自己的長(zhǎng)處�����。每一個(gè)圖表庫(kù)有多個(gè)定制選項(xiàng)���,其中大部分rCharts都支持。
NVD3 是一個(gè)旨在建立可復(fù)用的圖表和組件的 d3.js 項(xiàng)目——它提供了同樣強(qiáng)大的功能��,但更容易使用。它可以讓我們處理復(fù)雜的數(shù)據(jù)集來(lái)創(chuàng)建更高級(jí)的可視化��。在rCharts包中提供了nPlot函數(shù)來(lái)實(shí)現(xiàn)���。
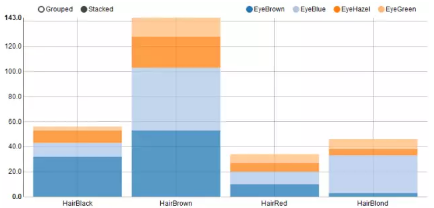
下面以眼睛和頭發(fā)顏色的數(shù)據(jù)(HairEyeColor)為例說明nPlot繪圖的基本原理���。我們按照眼睛的顏色進(jìn)行分組(group=”eye”),對(duì)頭發(fā)顏色人數(shù)繪制柱狀圖,并將類型設(shè)置為柱狀圖組合方式(type=”multiBarChart”)�,這樣可以實(shí)現(xiàn)分組和疊加效果。
library(rCharts)
hair_eye_male <- subset(as.data.frame(HairEyeColor), Sex == "Male")
hair_eye_male[,1] <- paste0("Hair",hair_eye_male[,1])
hair_eye_male[,2] <- paste0("Eye",hair_eye_male[,2])
n1 <- nPlot(Freq ~ Hair, group = "Eye", data = hair_eye_male,
type = "multiBarChart")
n1
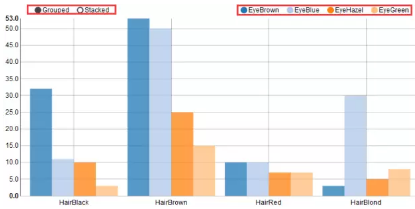
可以通過圖形右上角選擇需要查看或隱藏的類別(默認(rèn)是全部類別顯示的)���,也能通過左上角選擇柱子是按照分組還是疊加的方式進(jìn)行擺放(默認(rèn)是分組方式)����。如果選擇Stacked�����,就會(huì)繪制疊加柱狀圖�����。
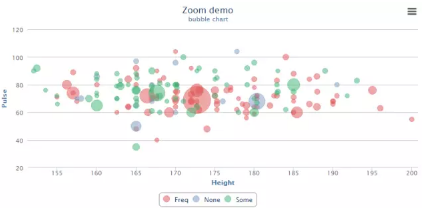
Highcharts是一個(gè)制作圖表的純Javascript類庫(kù),支持大部分的圖表類型:直線圖�,曲線圖、區(qū)域圖�、區(qū)域曲線圖、柱狀圖����、餅狀圖、散布圖等�。在rCharts包中提供了hPlot函數(shù)來(lái)實(shí)現(xiàn)。
以MASS包中的學(xué)生調(diào)查數(shù)據(jù)集survery為例�����,說明hPlot繪圖的基本原理�。我們繪制學(xué)生身高和每分鐘脈搏跳動(dòng)次數(shù)的氣泡圖,以年齡變量作為調(diào)整氣泡大小的變量���。
library(rCharts)
a <- hPlot(Pulse ~ Height, data = MASS::survey, type = "bubble",
title = "Zoom demo", subtitle = "bubble chart",
size = "Age", group = "Exer")
a$colors('rgba(223, 83, 83, .5)', 'rgba(119, 152, 191, .5)',
'rgba(60, 179, 113, .5)')
a$chart(zoomType = "xy")
a$exporting(enabled = T)
a
rCharts包可以畫出更多漂亮的交互圖��, http://ramnathv.github.io/rCharts/和https://github.com/ramnathv/rCharts/tree/master/demo有更多的例子可供大家學(xué)習(xí)����。
recharts包
學(xué)習(xí)完rCharts包���,可能有讀者會(huì)問���,我們有沒有國(guó)人開發(fā)的包實(shí)現(xiàn)相似的效果呢?這邊給大家推薦一個(gè)同樣功能強(qiáng)大的recharts包����。
本包來(lái)源于百度開發(fā)的國(guó)內(nèi)頂尖水平的開源d3-js可視項(xiàng)目Echarts(Github Repo)。Yang Zhou和Taiyun Wei基于該工具開發(fā)了recharts包�����,經(jīng)Yihui Xie修改后����,可通過htmlwidgets傳遞js參數(shù),大大簡(jiǎn)化了開發(fā)難度���。但此包開發(fā)仍未完成��。為了趕緊上手用��,基于該包做了一個(gè)函數(shù)echartR(下載至本地��,以后通過source命令加載)���,用于制作基礎(chǔ)Echart交互圖�����。需要R版本>=3.2.0.
安裝方式如下:
library(devtools)
install_github('yihui/recharts')
安裝完后�����,需要在https://github.com/madlogos/recharts/blob/master/R/echartR.R將echartR.R腳本下載到本地�����。
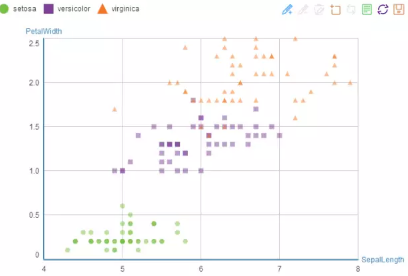
假如想對(duì)鳶尾花數(shù)據(jù)集繪制散點(diǎn)圖�,可以執(zhí)行如下代碼:
source("~echartR.R")
names(iris) = gsub("\\.", "", names(iris))
echartR(data=iris,x=~SepalLength,y=~PetalWidth,series = ~Species,
type = 'scatter')
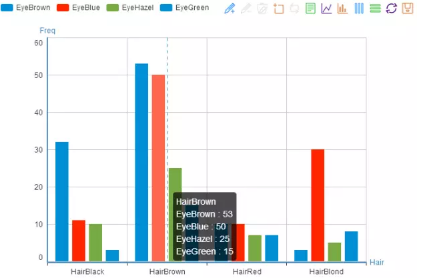
繪制柱狀圖:
hair_eye_male <- subset(as.data.frame(HairEyeColor), Sex == "Male")
hair_eye_male[,1] <- paste0("Hair",hair_eye_male[,1])
hair_eye_male[,2] <- paste0("Eye",hair_eye_male[,2])
echartR(data = hair_eye_male, x = Hair, y = ~Freq, series = ~Eye,
type = 'bar', palette='fivethirtyeight',
xlab = 'Hair', ylab = 'Freq')
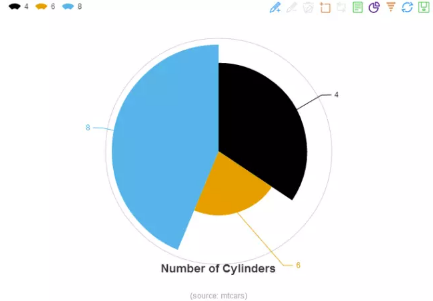
玫瑰圖:
dtcars <- mtcars
dtcars$car <- row.names(dtcars)
dtcars$transmission <- as.factor(dtcars$am)
levels(dtcars$transmission) <- c("Automatic","Manual")
dtcars$cylinder <- as.factor(dtcars$cyl)
dtcars$carburetor <-as.factor(dtcars$carb)
echartR(dtcars, x = ~cylinder, y = ~car, type='rose',
palette='colorblind', title='Number of Cylinders',
subtitle = '(source: mtcars)')
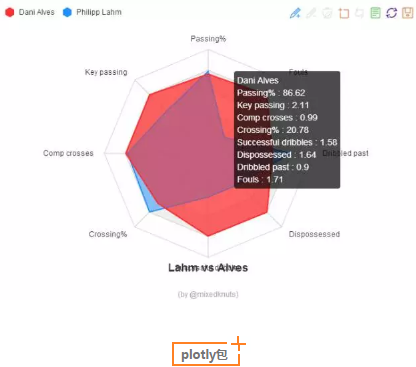
雷達(dá)圖:
player <- data.frame(name=c(rep("Philipp Lahm",8),rep("Dani Alves",8)),
para=rep(c("Passing%","Key passing","Comp crosses",
"Crossing%","Successful dribbles",
"Dispossessed","Dribbled past","Fouls"),2),
value=c(89.67, 1.51, 0.97, 24.32, 0.83, 0.86, 1.15, 0.47,
86.62, 2.11, 0.99, 20.78, 1.58, 1.64, 0.9, 1.71))
echartR(player, x= ~para, y= ~value, series= ~name, type='radarfill',
symbolList='none', palette=c('firebrick1','dodgerblue'),
title='Lahm vs Alves', subtitle= '(by @mixedknuts)')
plotly包
接下來(lái)要給大家介紹的是另一個(gè)功能強(qiáng)大的plotly包����。它是一個(gè)基于瀏覽器的交互式圖表庫(kù),它建立在開源的JavaScript圖表庫(kù)plotly.js之上�。
有兩種安裝方式:
install.packages("plotly")
或者
devtools::install_github("ropensci/plotly")
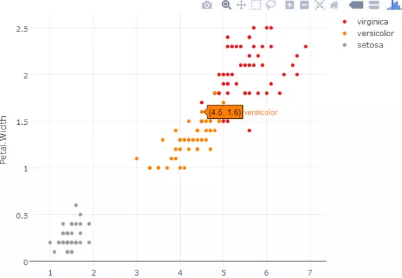
plotly包利用函數(shù)plot_ly函數(shù)繪制交互圖。
如果相對(duì)鳶尾花數(shù)據(jù)集繪制散點(diǎn)圖���,需要將mode參數(shù)設(shè)置為”markers”��。
library(plotly)
p <- plot_ly(iris, x = Petal.Length, y = Petal.Width,
color = Species, colors = "Set1", mode = "markers")
p
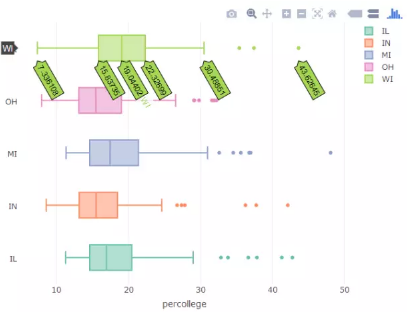
如果想繪制交互箱線圖�,需要將type參數(shù)設(shè)置為box。
library(plotly)
plot_ly(midwest, x = percollege, color = state, type = "box")
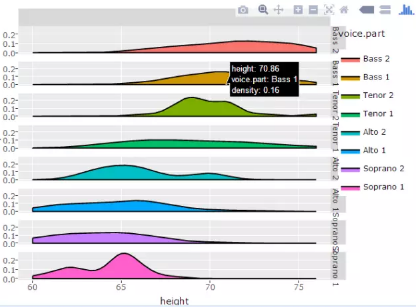
如果你已熟悉ggplot2的繪圖系統(tǒng)�,也可以針對(duì)ggplot2繪制的對(duì)象p,利用ggplotly函數(shù)實(shí)現(xiàn)交互效果����。例如我們想對(duì)ggplot繪制的密度圖實(shí)現(xiàn)交互效果����,執(zhí)行以下代碼即可:
library(plotly)
p <- ggplot(data=lattice::singer,aes(x=height,fill=voice.part))+
geom_density()+
facet_grid(voice.part~.)
(gg <- ggplotly(p))
其他
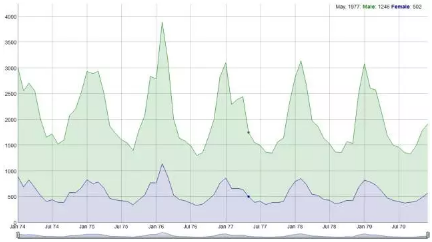
此外還有很多好玩有用的交互包。例如專門用來(lái)畫交互時(shí)序圖的dygraphs包�,可通過install.packages(“dygraphs”)安裝。
library(dygraphs)
lungDeaths <- cbind(mdeaths, fdeaths)
dygraph(lungDeaths) %>%
dySeries("mdeaths", label = "Male") %>%
dySeries("fdeaths", label = "Female") %>%
dyOptions(stackedGraph = TRUE) %>%
dyRangeSelector(height = 20)
DT包實(shí)現(xiàn)R數(shù)據(jù)對(duì)象可以在HTML頁(yè)面中實(shí)現(xiàn)過濾����、分頁(yè)、排序以及其他許多功能�����。通過install.packages(“DT”)安裝����。
以鳶尾花數(shù)據(jù)集iris為例,執(zhí)行以下代碼:
library(DT)
datatable(iris)
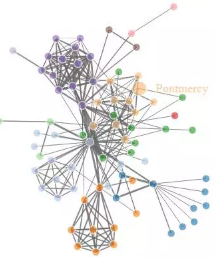
networkD3包可實(shí)現(xiàn)D3 JavaScript的網(wǎng)絡(luò)圖�����,通過install.packages(“networkD3”)安裝。
下面是繪制一個(gè)力導(dǎo)向的網(wǎng)絡(luò)圖的例子���。
library(treemap)
library(d3treeR)
data("GNI2014")
tm <- treemap(
GNI2014,
index=c("continent", "iso3"),
vSize="population",
vColor="GNI",
type="value"
)
d3tree( tm,rootname = "World" )
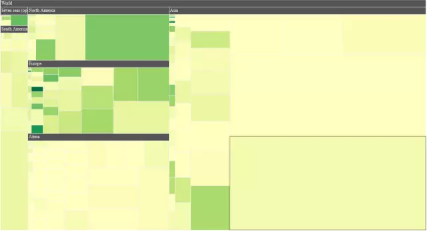
我們可以通過d3treeR包繪制交互treemap圖�,利用
devtools::install_github("timelyportfolio/d3treeR")
完成d3treeR包安裝���。
library(treemap)
library(d3treeR)
data("GNI2014")
tm <- treemap(
GNI2014,
index=c("continent", "iso3"),
vSize="population",
vColor="GNI",
type="value"
)
d3tree( tm,rootname = "World" )
本文主要是介紹了幾個(gè)R常用的交互包����。在R的環(huán)境中�����,動(dòng)態(tài)交互圖形的優(yōu)勢(shì)在于能和knitr��、shiny等框架整合在一起��,能迅速建立一套可視化原型系統(tǒng)�。
CDA數(shù)據(jù)分析師考試相關(guān)入口一覽(建議收藏):
? 想報(bào)名CDA認(rèn)證考試,點(diǎn)擊>>>
“CDA報(bào)名”
了解CDA考試詳情�����;
? 想學(xué)習(xí)CDA考試教材,點(diǎn)擊>>> “CDA教材” 了解CDA考試詳情����;
? 想加入CDA考試題庫(kù),點(diǎn)擊>>> “CDA題庫(kù)” 了解CDA考試詳情�����;
? 想了解CDA考試含金量����,點(diǎn)擊>>> “CDA含金量” 了解CDA考試詳情��;


 京公網(wǎng)安備 11010802034615號(hào)
經(jīng)營(yíng)許可證編號(hào):京B2-20210330
京公網(wǎng)安備 11010802034615號(hào)
經(jīng)營(yíng)許可證編號(hào):京B2-20210330