R語言炫技必備基本功
R語言主要用于統(tǒng)計分析和繪圖�,可以理解為是一種數學計算軟件,可編程���,有很多有用的函數庫和數據集����,它強大的作圖工具是做數據分析的好幫手���,在高手如云的大數據江湖中��,不炫個技都不敢說自己是江湖中人����,那么我們就看看想要炫技需要掌握哪些基本功吧
注意:本文中實際使用的樣本數據是根據具體命令任意挑選某組樣本數據��,不具有針對性���,因此自己試驗可以隨意找樣本嘗試
一個table引發(fā)的血案
table函數就是用來輸出指定字段的統(tǒng)計表格,可以用來分析數據比例情況,像下面的樣子:
> table(full$Title, full$Survived)
0 1
Master 17 23
Miss 55 130
Mr 436 81
Mrs 26 100
Rare Title 15 8
那么為了讓table夠直觀���,各路大俠紛紛使出了洪荒之力,注意�,下面開始炫技部分:
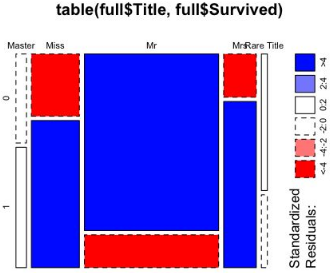
第一種作圖方式(用于觀察標準殘差的場景):
> mosaicplot(table(full$Title, full$Survived), shade=TRUE)
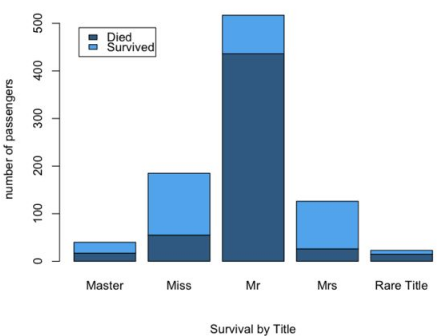
第二種作圖方式(用于觀察總數目的場景):
> barplot(table(full$Survived, full$Title), sub="Survival by Title", ylab="number of passengers", col=c("steelblue4","steelblue2"))
> le> barplot(table(full$Survived, full$Title), sub="Survival by Title", ylab="number of passengers", col=c("steelblue4","steelblue2"))
> legend("topleft",legend = c("Died","Survived"),fill=c("steelblue4","steelblue2"),inset = .05)
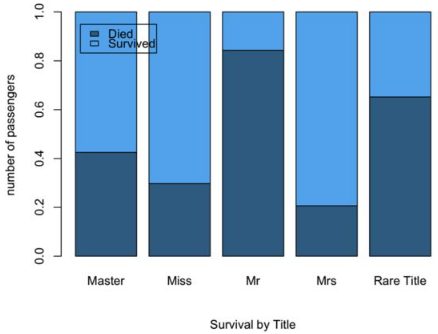
第三種作圖方式(用于觀察比例情況的場景):
> barplot(prop.table(table(full$Survived, full$Title),2), sub="Survival by Title", ylab="number of passengers", col=c("steelblue4","steelblue2"))
> legend("topleft",legend = c("Died","Survived"),fill=c("steelblue4","steelblue2"),inset = .05)
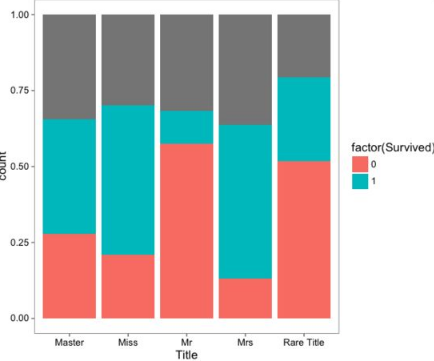
當然還可以有第四種作圖方式(同樣是用于觀察比例情況的場景):
> library('ggthemes')
> ggplot(full, aes(x = Title, fill = factor(Survived))) + geom_bar(stat='count', position='fill') + theme_few()
不同風格的決策樹
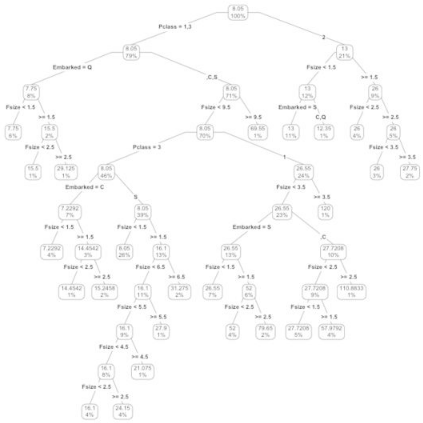
在上節(jié)數據缺失填補中我們見過這樣一棵決策樹:
> library("rpart")
> library("rpart.plot")
> my_tree <- rpart(Fare ~ Pclass + Fsize + Embarked, data = train, method = "class", control=rpart.control(cp=0.0001))
> prp(my_tree, type = 4, extra = 100)
如果我們想看到每個分支的比例關系還可以在枝干上下文章:
> prp(my_tree, type = 2, extra = 100,branch.type=1)
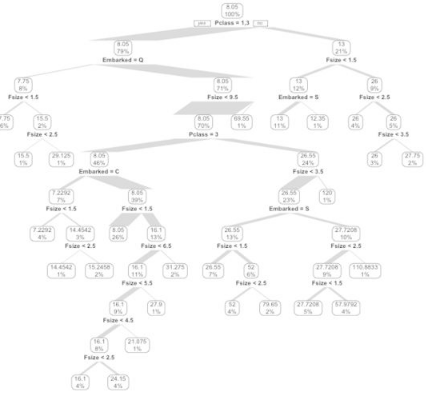
圖中根據不同的枝干粗細能看出樣本集中在那個分支上
數據總覽方式
第一種:按列總覽
優(yōu)點:可以看到有哪些列,什么類型�,每一列取值舉幾個例子,也能看到有多少行
> str(train)
'data.frame': 2197291 obs. of 15 variables:
$ people_id : chr "ppl_100" "ppl_100" "ppl_100" "ppl_100" ...
$ activity_id : chr "act2_1734928" "act2_2434093" "act2_3404049" "act2_3651215" ...
$ date : chr "2023-08-26" "2022-09-27" "2022-09-27" "2023-08-04" ...
$ activity_category: chr "type 4" "type 2" "type 2" "type 2" ...
$ char_1 : chr "" "" "" "" ...
$ char_2 : chr "" "" "" "" ...
$ char_3 : chr "" "" "" "" ...
$ char_4 : chr "" "" "" "" ...
$ char_5 : chr "" "" "" "" ...
$ char_6 : chr "" "" "" "" ...
$ char_7 : chr "" "" "" "" ...
$ char_8 : chr "" "" "" "" ...
$ char_9 : chr "" "" "" "" ...
$ char_10 : chr "type 76" "type 1" "type 1" "type 1" ...
$ outcome : int 0 0 0 0 0 0 1 1 1 1 ...
第二種:分布總覽
優(yōu)點:能看出每一列的最大值����、最小值、均值���、中位數等分布數據
> summary(train)
comment_count sex has_free_course score
Min. : 0.0 Min. :0.0000 Min. :0.0000 Min. :0.00
1st Qu.: 0.0 1st Qu.:0.0000 1st Qu.:0.0000 1st Qu.:0.00
Median : 9.0 Median :1.0000 Median :0.0000 Median :4.90
Mean : 397.6 Mean :0.6259 Mean :0.3786 Mean :2.92
3rd Qu.: 169.0 3rd Qu.:1.0000 3rd Qu.:1.0000 3rd Qu.:5.00
Max. :5409.0 Max. :2.0000 Max. :1.0000 Max. :5.00
第三種:采樣瀏覽
優(yōu)點:可以抽出其中少數樣本看全部信息
> library(dplyr)
> sample_n(train, 4)
> sample_n(train, 4)
people_id activity_id date activity_category char_1 char_2
513235 ppl_184793 act2_3805654 2023-02-25 type 2
1127284 ppl_29203 act2_1960547 2022-09-16 type 5
1174958 ppl_294918 act2_3624924 2022-10-19 type 3
1794311 ppl_390987 act2_633897 2023-02-10 type 2
char_3 char_4 char_5 char_6 char_7 char_8 char_9 char_10 outcome
513235 type 1 0
1127284 type 1349 1
1174958 type 23 0
1794311 type 1 0
第四種:用戶友好的表格采樣瀏覽
優(yōu)點:不自動換行����,按表格形式組織����,直觀
> library(knitr)
> kable(sample_n(train, 4))
> kable(sample_n(train, 4))
| |people_id |activity_id |date |activity_category |char_1 |char_2 |char_3 |char_4 |char_5 |char_6 |char_7 |char_8 |char_9 |char_10 | outcome|
|:-------|:----------|:------------|:----------|:-----------------|:------|:------|:------|:------|:------|:------|:------|:------|:------|:---------|-------:|
|1784154 |ppl_389138 |act2_2793972 |2022-11-03 |type 5 | | | | | | | | | |type 649 | 1|
|1138360 |ppl_294144 |act2_149226 |2022-09-18 |type 5 | | | | | | | | | |type 1058 | 0|
|1698603 |ppl_373844 |act2_3579388 |2022-08-27 |type 4 | | | | | | | | | |type 230 | 0|
|1505324 |ppl_351017 |act2_2570186 |2022-09-30 |type 5 | | | | | | | | | |type 248 | 0|
請尊重原創(chuàng)����,轉載請注明來源網站www.shareditor.com以及原始鏈接地址
R語言中的管道
shell中管道非常方便,比如把一個文件中第二列按數字排序后去重可以寫成cat file | awk '{print $2}' | sort -n -k 1 | uniq��,那么R語言中的管道怎么用呢�?我們先來看一個例子:
> library(dplyr)
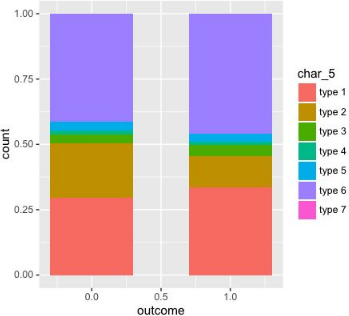
> ggplot(filter(train, char_5 != ""), aes(x = outcome, fill = char_5)) + geom_bar(width = 0.6, position = "fill")
這個例子中有以下處理步驟:
1. 拿出train數據
2. 對train數據做過濾,過濾掉char_5這一列為空的樣本
3. 用過濾好的數據執(zhí)行ggplot畫圖
這三部如果用一層層管道操作就方便多了��,實際上R語言為我們提供了這樣的管道���,即把函數的第一個參數單獨提出來作為管道輸入,管道操作符是%>%�����,也就是可以這樣執(zhí)行:
> train %>%
+ filter(char_5 != "") %>%
+ ggplot(aes(x=outcome, fill=char_10))+geom_bar(width=0.6, position="fill")
那么管道到底有什么好處呢�?我們來追蹤一下實際的過程來體會
假設我們樣本長這個樣子:
> library(knitr)
> kable(sample_n(train, 4))
| |people_id |activity_id |date |activity_category |char_1 |char_2 |char_3 |char_4 |char_5 |char_6 |char_7 |char_8 |char_9 |char_10 | outcome|
|:-------|:----------|:------------|:----------|:-----------------|:------|:------|:------|:------|:------|:------|:------|:------|:------|:---------|-------:|
|567545 |ppl_194099 |act2_1420548 |2023-02-08 |type 2 | | | | | | | | | |type 1 | 0|
|115164 |ppl_112033 |act2_2209862 |2022-10-23 |type 5 | | | | | | | | | |type 481 | 1|
|1616290 |ppl_369463 |act2_2515098 |2023-07-11 |type 4 | | | | | | | | | |type 295 | 0|
|1714893 |ppl_376799 |act2_1464019 |2022-10-01 |type 5 | | | | | | | | | |type 1907 | 0|
這時我們發(fā)現(xiàn)有一些列是空值,如果我希望了解一下其中的char_5都有哪些取值以及比例情況����,我們可以這樣來做:
> train %>%
+ count(char_5)
# A tibble: 8 × 2
char_5 n
<chr> <int>
1 2039676
2 type 1 49214
3 type 2 26982
4 type 3 6013
5 type 4 1995
6 type 5 5421
7 type 6 67989
8 type 7 1
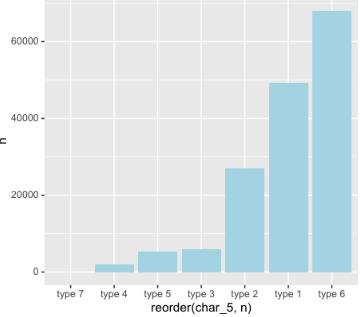
現(xiàn)在我們看到了輸出了char_5和n兩列分別表示可能取值和頻次,但是還是不夠直觀����,希望畫圖來看,那么我們繼續(xù):
> train %>%
+ count(char_5) %>%
+ ggplot(aes (x = reorder(char_5,n), y = n)) +
+ geom_bar(stat = "identity", fill = "light blue")
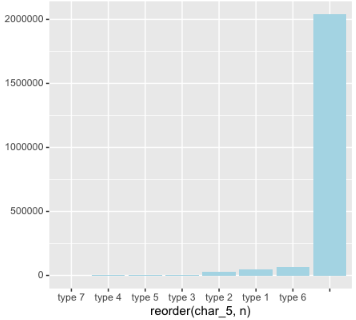
發(fā)現(xiàn)我們有很多空值���,這時我們繼續(xù)調整:
> train %>%
+ filter(char_5!="") %>%
+ count(char_5) %>%
+ ggplot(aes (x = reorder(char_5,n), y = n)) +
+ geom_bar(stat = "identity", fill = "light blue")
這就是我們的管道的作用:一步一步調試�,不需要總想著把參數插到函數的哪個位置
回到本源��,最基本的作圖
有人會說���,R語言怎么總是畫這么復雜的圖像�����,但是卻連最基本的散點圖和折線圖都不能畫嗎���?下面回到本源,來展示一下R語言的最基本的作圖功能�。
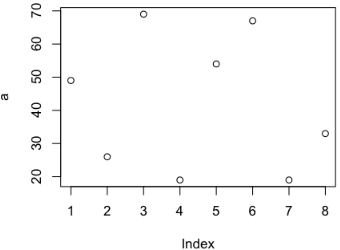
散點圖
> a <- c(49, 26, 69, 19, 54, 67, 19, 33)
> plot(a)
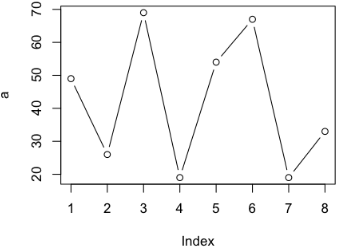
如果希望看到變化趨勢,我們可以畫折線圖����,加上type即可
> plot(a, type='b')
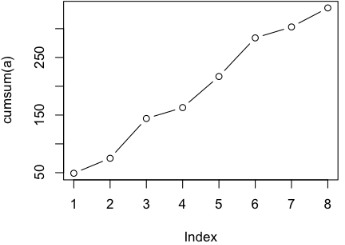
如果這是一個每日消費金額,我們想看累積消費怎么辦�����?我們可以利用累積函數cumsum,它的功能像這個樣子:
> a
[1] 49 26 69 19 54 67 19 33
> cumsum(a)
[1] 49 75 144 163 217 284 303 336
>
那么可以這樣作圖:
> plot(cumsum(a), type='b')
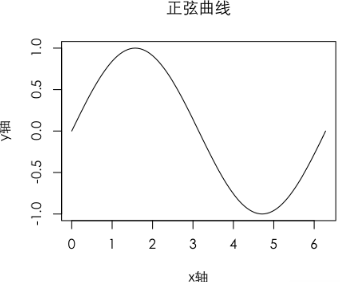
最后讓我們用一個完美的正弦曲線收筆:
> x1 <- 0:100
> x2 <- x1 * 2 * pi / 100
> Y = sin(x2)
> par(family='STXihei') # 這句是為了解決圖像中中文亂碼問題
> plot(x2, Y, type='l', main='正弦曲線', xlab='x軸', ylab='y軸')
CDA數據分析師考試相關入口一覽(建議收藏):
? 想報名CDA認證考試���,點擊>>>
“CDA報名”
了解CDA考試詳情�����;
? 想學習CDA考試教材���,點擊>>> “CDA教材” 了解CDA考試詳情;
? 想加入CDA考試題庫��,點擊>>> “CDA題庫” 了解CDA考試詳情��;
? 想了解CDA考試含金量���,點擊>>> “CDA含金量” 了解CDA考試詳情��;


 京公網安備 11010802034615號
經營許可證編號:京B2-20210330
京公網安備 11010802034615號
經營許可證編號:京B2-20210330