本文部分摘自CDA數(shù)據(jù)科學(xué)家訓(xùn)練營課程,版權(quán)私有����,維權(quán)必究,轉(zhuǎn)載請注明出處���。
總結(jié)一下2016年5月29日數(shù)據(jù)科學(xué)家訓(xùn)練營R語言課程中Echart學(xué)習(xí)成果���,也把上課用Echart做的圖表及腳步代碼和大家分享���。先講下大概的內(nèi)容,方便大家上手~
【數(shù)據(jù)源】
數(shù)據(jù)源見云盤:https://yunpan.cn/cSGKXSqYMGULs 訪問密碼 ea56
ECHART 安裝(R-3.3.0測試可用)3/3
install.packages('devtools')
library(devtools)
install_github('yihui/recharts') ##全局設(shè)定
Sys.setlocale("LC_CTYPE","Chs")
source("F:\\ORE\\2.ORESERVER\\oreSCRIPT\\ECHART\\echartR.R") ##全局設(shè)定
install.packages('knitr')
library(knitr)
knitr::opts_chunk$set(message=FALSE,warning=FALSE,results='asis')
讀取數(shù)據(jù)及數(shù)據(jù)預(yù)處理
#數(shù)據(jù)集說明:汽車貸款違約數(shù)據(jù)
#使用的變量N:數(shù)值變量/T:因變量
##[N]fico_score信用評分
##[N]purch_price 汽車價格
##[N]loan_amt 貸款金額
##[T]bad_ind 是否違約
#讀取數(shù)據(jù)與數(shù)據(jù)預(yù)處理
setwd("F:\\數(shù)據(jù)腳本課件\\數(shù)據(jù)")
data=read.csv('accepts.csv')
data$bad_ind=as.factor(data$bad_ind)
data$bankruptcy_ind=as.factor(data$bankruptcy_ind)
data$used_ind=as.factor(data$used_ind)
#缺失值填補(均值/眾數(shù)填補)
#定義缺失值填補函數(shù)
tianbu=function(data){
for (i in 1:ncol(data)){
if (sum(is.na(data[,i]))!=0){
if (class(data[,i])=='factor'){
a=(as.data.frame(table(data[,i])))
b=as.numeric(max(mode))
mode=as.character(a[which(a$Freq==b),1])
data[which(is.na(data[,i])=='TRUE'),i]=mode[1]
} #因子使用眾數(shù)填補
else {
data[which(is.na(data[,i])=='TRUE'),i]=mean(data[,i],na.rm=T)
} #非因子使用平均數(shù)填補
}
else
warning(paste('變量',colnames(data)[i],'無缺失無需填補',sep=''))}
}
#進行填補
tianbu(data=data)
data
warnings()
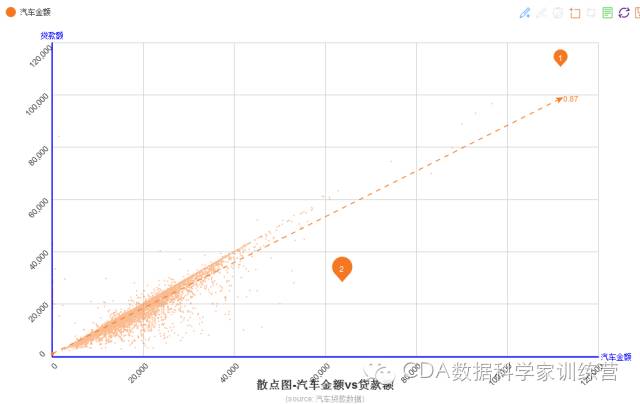
1.多系列散點圖
#echart語法見https://github.com/madlogos/recharts
#標(biāo)注線(標(biāo)注線性歸回擬合線)
Line=t(c(1,'lm',"lm",F))
#標(biāo)注點(標(biāo)注兩個異常值點)
Points=rbind(c(1,NA,1,111696,111166,F),c(1,NA,2,63700,28700,F))
#橫縱軸設(shè)定
x=list(lab='汽車金額',color='blue',rotate=45)
y=list(lab='貸款額',color='blue',rotate=45)
#制圖
echartR(data = data, x = ~purch_price, y = ~loan_amt,
type = 'scatter', palette='aetnaorange',
title = '散點圖-汽車金額vs貸款額',
subtitle = "(source: 汽車貸款數(shù)據(jù))",
xAxis = x, yAxis = y,
markLine=Line,
markPoint=Points)
圖形展示如下:
 動態(tài)圖見連接:
http://localhost:31357/session/viewhtmlcfc382479f9/index.html
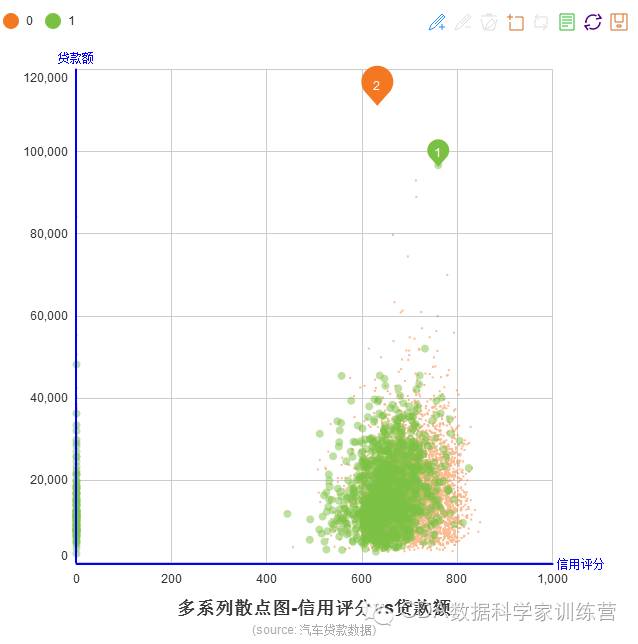
2.多系列散點圖
#標(biāo)注點(標(biāo)注兩個異常值點)
Points=rbind(c(2,NA,1,760,96692,F),c(1,NA,2,632,111554,F))
#橫縱軸設(shè)定
x=list(lab='信用評分',color='blue')
y=list(lab='貸款額',color='blue')
#制圖
echartR(data = data, x = ~fico_score, y = ~loan_amt, series = ~bad_ind,
type = 'scatter', palette='aetnaorange', symbolList='circle',
scale=F, xAxis = x,yAxis = y,
title = '多系列散點圖-信用評分vs貸款額',
subtitle = "(source: 汽車貸款數(shù)據(jù))",
markPoint=Points)
圖形展示如下:
動態(tài)圖見連接:
http://localhost:31357/session/viewhtmlcfc382479f9/index.html
2.多系列散點圖
#標(biāo)注點(標(biāo)注兩個異常值點)
Points=rbind(c(2,NA,1,760,96692,F),c(1,NA,2,632,111554,F))
#橫縱軸設(shè)定
x=list(lab='信用評分',color='blue')
y=list(lab='貸款額',color='blue')
#制圖
echartR(data = data, x = ~fico_score, y = ~loan_amt, series = ~bad_ind,
type = 'scatter', palette='aetnaorange', symbolList='circle',
scale=F, xAxis = x,yAxis = y,
title = '多系列散點圖-信用評分vs貸款額',
subtitle = "(source: 汽車貸款數(shù)據(jù))",
markPoint=Points)
圖形展示如下:
 動態(tài)圖鏈接:
http://localhost:31357/session/viewhtmlcfc328666f2/index.html
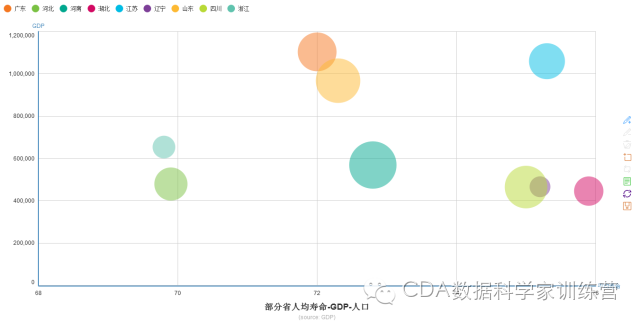
3. 氣泡圖
#數(shù)據(jù)集說明:中國各省人口GDP和人均壽命數(shù)據(jù)
#使用的變量N:數(shù)值變量
#Prov:省份
#GDP:GDP
#LIFE:平均壽命
#POPULATION:人口
#讀取數(shù)據(jù)
China=read.csv('gdp.csv')
#Bubble 氣泡圖
echartR(data = China, x = ~Life, y = ~GDP,
weight =Population, series = ~Prov,
symbolList=c('circle'),
type = 'bubble', palette='aetnaorange',
title = '部分省人均壽命-GDP-人口',
subtitle = '(source: GDP)', xlab = '平均壽命', ylab = 'GDP',
pos=list(title=6,toolbox=3))
圖形展示如下:
動態(tài)圖鏈接:
http://localhost:31357/session/viewhtmlcfc781586d/index.html
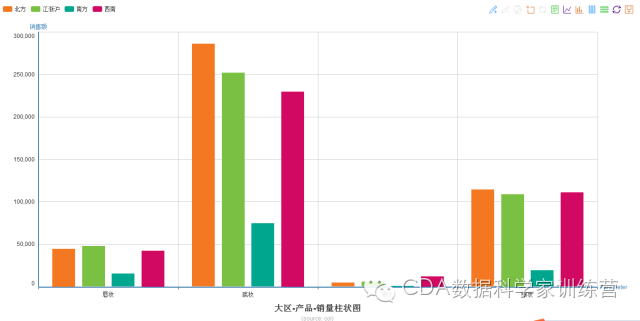
4.柱狀圖
library(reshape2)
#數(shù)據(jù)描述:某化妝品公司數(shù)據(jù)集
#dis:大區(qū)(series)
#type:產(chǎn)品名(x)
#amount銷量(y)
#讀取數(shù)據(jù)與數(shù)據(jù)預(yù)處理
setwd("F:\\數(shù)據(jù)腳本課件\\數(shù)據(jù)")
data=read.csv('col.csv')
#Tiled Column柱狀圖
echartR(data = data, x = ~type, y = ~amount,
series = ~dis,stack=F,
type = 'bar', palette='aetnaorange',
title = "大區(qū)-產(chǎn)品-銷量柱狀圖",
subtitle = '(source: col)',
xlab = 'Parameter', ylab = '銷售額')
圖形展示如下:
 動態(tài)圖鏈接:
http://localhost:31357/session/viewhtmlcfc4981968/index.html
動態(tài)圖鏈接:
http://localhost:31357/session/viewhtmlcfc4981968/index.html
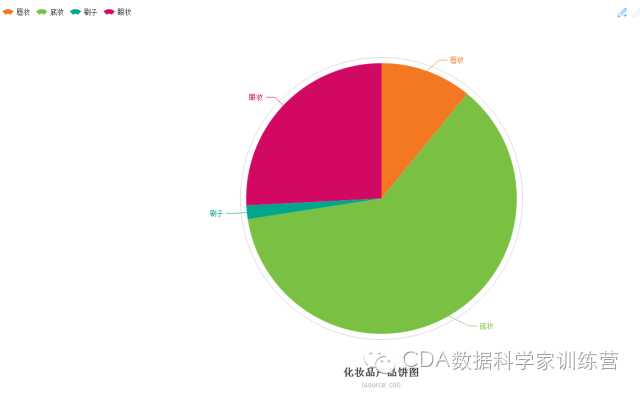
5.餅圖
#數(shù)據(jù)準(zhǔn)備
setwd("F:\\數(shù)據(jù)腳本課件\\數(shù)據(jù)")
data=read.csv('col.csv')
#1.ECHART PIE 餅圖
echartR(data, x = ~type, y = ~amount, type='pie',
palette='aetnaorange',
title='化妝品產(chǎn)品餅圖',
subtitle = '(source: col)')
圖形展示如下:
 動態(tài)圖鏈接:
http://localhost:31357/session/viewhtmlcfc4ca6c45/index.html
動態(tài)圖鏈接:
http://localhost:31357/session/viewhtmlcfc4ca6c45/index.html
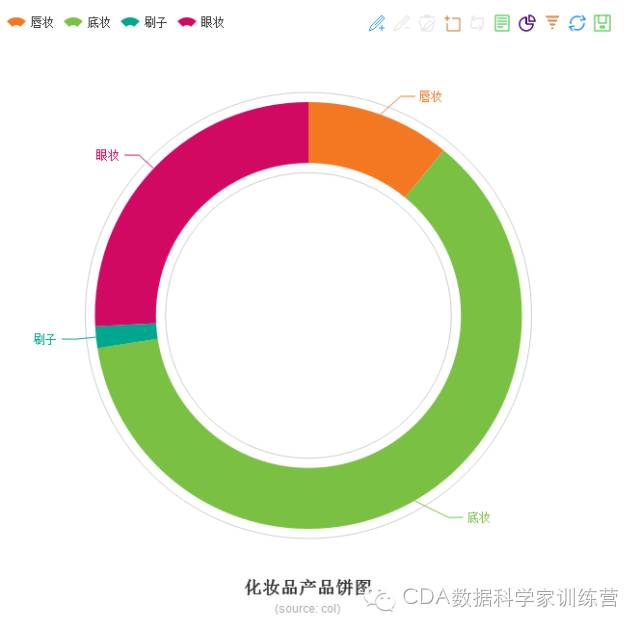
6.環(huán)圖
echartR(data, x = ~type, y = ~amount, type='ring',
palette='aetnaorange',
title='化妝品產(chǎn)品餅圖',
subtitle = '(source: col)')
圖形展示如下:
動態(tài)圖鏈接:
http://localhost:31357/session/viewhtmlcfc67d01c83/index.html
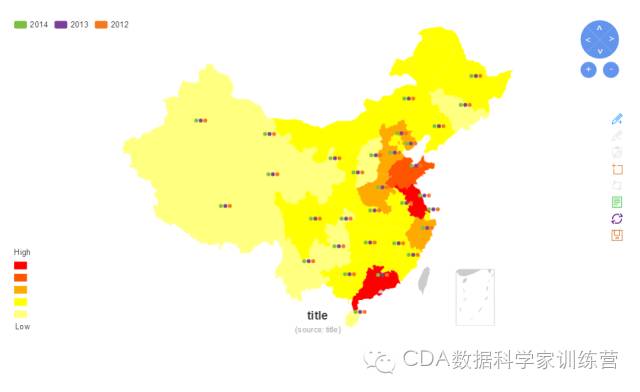
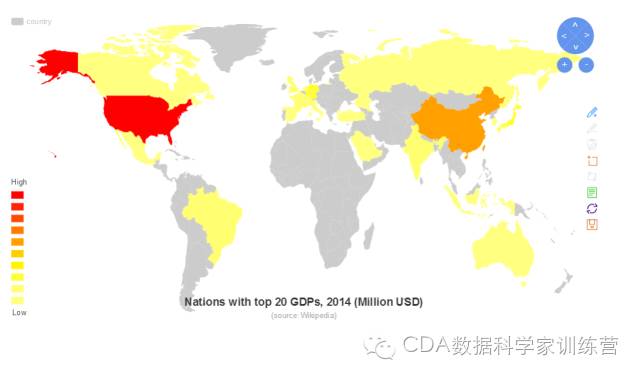
7.地圖
#數(shù)據(jù)準(zhǔn)備
setwd('F:\\數(shù)據(jù)腳本課件\\數(shù)據(jù)')
dtgdp1=read.csv('CHINA-GDP-12-14.csv')[2:4]
#區(qū)域標(biāo)注
echartR(dtgdp1, x = ~Prov, y = ~GDP, series= ~Year,
type=c('map','china','area'),
title="title",
subtitle='(source: title)',
dataRangePalette='heat(5)',
dataRange=c('High',"Low"),splitNumber=5,
pos=list(toolbox=3))
#區(qū)域標(biāo)注
worldgdp=data.frame(
country=c('United States of America','China','Japan','Germany',
'United Kingdom','France','Brazil', 'Italy','India','Russia',
'Canada','Australia','South Korea','Spain','Mexico','Indonesia',
'Netherlands','Turkey','Saudi Arabia','Switzerland'),
GDP=c(17418925,10380380,4616335,3859547,2945146,2846889,2353025,2147952,
2049501,1857461,1788717,1444189,1416949,1406855,1282725,888648,866354,
806108,752459,712050))
echartR(worldgdp, x = ~country, y = ~GDP, type=c('map','world','area'),
title="Nations with top 20 GDPs, 2014 (Million USD)",
subtitle = '(source: Wikipedia)',
dataRangePalette='heat(5)', dataRange=c("High","Low"),
splitNumber=10, pos=list(toolbox=3))
圖形展示如下:
動態(tài)圖鏈接:
http://localhost:31357/session/viewhtmlcfc73be3b89/index.html
http://localhost:31357/session/viewhtmlcfc66dc5ced/index.html
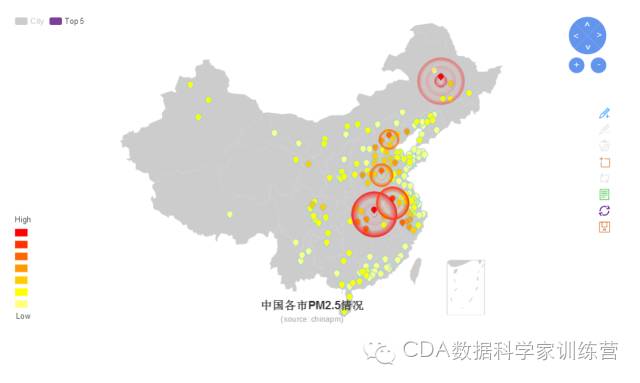
#Point 點標(biāo)注
#數(shù)據(jù)讀取
chinapm=read.csv('chinapm25.csv',stringsAsFactors=F,header=T,sep=',')[,2:5]
#點標(biāo)注
top5=head(chinapm[order(chinapm$PM,decreasing=T),],5)
top5$Name="Top 5"
top5$effect=T
top5=top5[,c(5,1,2,4,3,6)]
#制圖
echartR(chinapm, x=~City, y=~PM25, xcoord=~xcoord, ycoord=~ycoord,
type=c('map','china','point'),
title='中國各市PM2.5情況',
subtitle="(source: chinapm)",
dataRange=c("High","Low"), pos=list(toolbox=3),
dataRangePalette='heat(7)',
splitNumber=7,
markPoint=top5)
圖形展示如下:
動態(tài)圖鏈接:
http://localhost:31357/session/viewhtmlcfc36cf1824/index.html
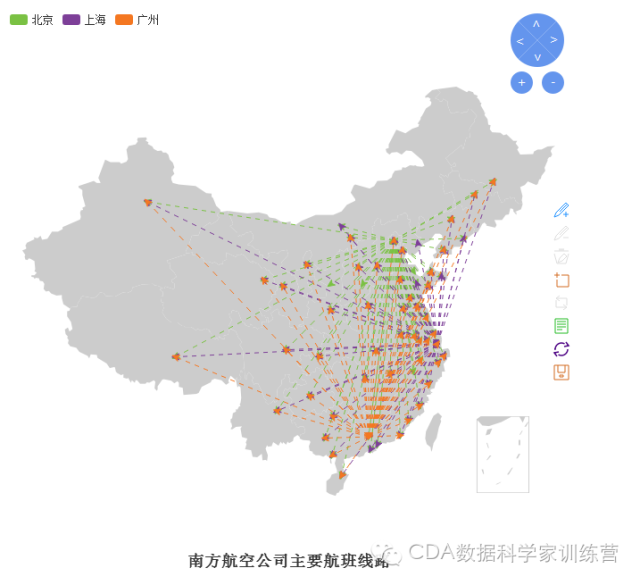
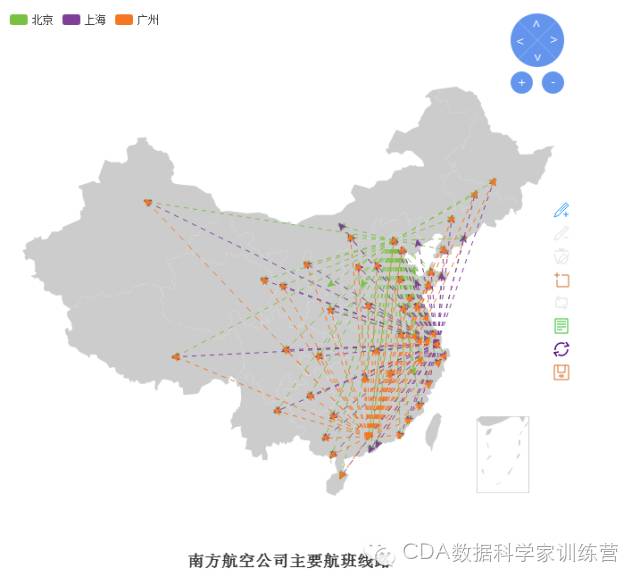
#Line 線標(biāo)注
flight=read.csv('flight.csv',stringsAsFactors=F,header=T,sep=',')
flight$y=''
names(flight)
echartR(flight, x=~From, x1=~To, y=~y, series=~From, xcoord=~Xcoord.x, ycoord=~Ycoord.x,
xcoord1=~Xcoord.y, ycoord1=~Ycoord.y, type=c('map','china','line'),
pos=list(toolbox=3), title="南方航空公司主要航班線路")
圖形展示如下:
圖形鏈接:
http://localhost:31357/session/viewhtmlcfc6518ec5/index.html
8.詞云
#獲取數(shù)據(jù)
setwd("F:\\數(shù)據(jù)腳本課件\\數(shù)據(jù)")
santi=read.csv('santi.csv')
santi
#構(gòu)建詞云
echartR(santi[1:30,], x=~word, y=~TFIDF, type="wordcloud",
title="《三體》特征詞", palette='aetnaorange',
subtitle="來源:三體")
圖形展示如下:
 動態(tài)圖鏈接:
http://localhost:31357/session/viewhtmlcfc6e7cdef/index.html
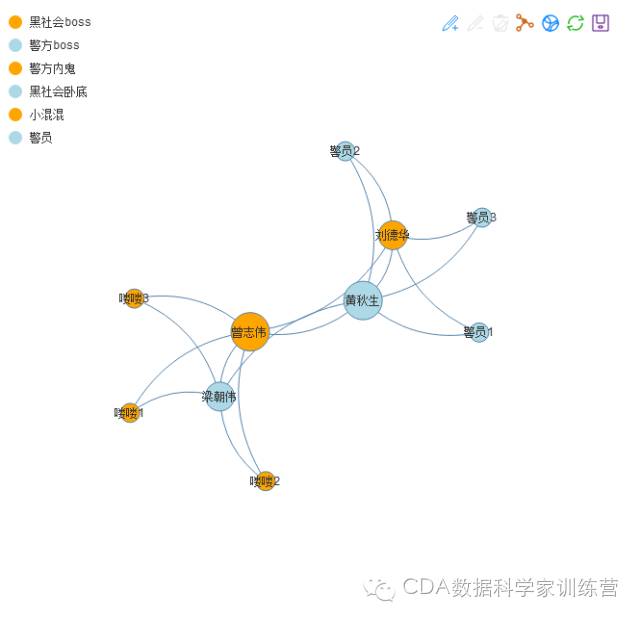
9.力導(dǎo)向布局圖
setwd('F:\\數(shù)據(jù)腳本課件\\數(shù)據(jù)')
wujiandao=read.csv('netLink.csv',stringsAsFactors=F)
echartR(wujiandao,
x=~Link,
y=~weight,
x1=~NodeVal,
series=~Series,type='force',
title='無間道',
pos=list(title=5,legend=10),
palette=c('orange','lightblue','orange','lightblue','orange','lightblue'))
圖形展示如下:
動態(tài)圖鏈接:
http://localhost:31357/session/viewhtmlcfc6e7cdef/index.html
9.力導(dǎo)向布局圖
setwd('F:\\數(shù)據(jù)腳本課件\\數(shù)據(jù)')
wujiandao=read.csv('netLink.csv',stringsAsFactors=F)
echartR(wujiandao,
x=~Link,
y=~weight,
x1=~NodeVal,
series=~Series,type='force',
title='無間道',
pos=list(title=5,legend=10),
palette=c('orange','lightblue','orange','lightblue','orange','lightblue'))
圖形展示如下:
 動態(tài)圖鏈接:
http://localhost:31357/session/viewhtmlcfc29f8671/index.html
CDA數(shù)據(jù)分析師考試相關(guān)入口一覽(建議收藏):
? 想報名CDA認(rèn)證考試�,點擊>>>
“CDA報名”
了解CDA考試詳情;
? 想學(xué)習(xí)CDA考試教材����,點擊>>> “CDA教材” 了解CDA考試詳情;
? 想加入CDA考試題庫����,點擊>>> “CDA題庫” 了解CDA考試詳情;
? 想了解CDA考試含金量��,點擊>>> “CDA含金量” 了解CDA考試詳情�����;


 京公網(wǎng)安備 11010802034615號
經(jīng)營許可證編號:京B2-20210330
京公網(wǎng)安備 11010802034615號
經(jīng)營許可證編號:京B2-20210330