2019-02-20
閱讀量:
2203
多組數(shù)據(jù)的直方圖與密度圖的繪制方法
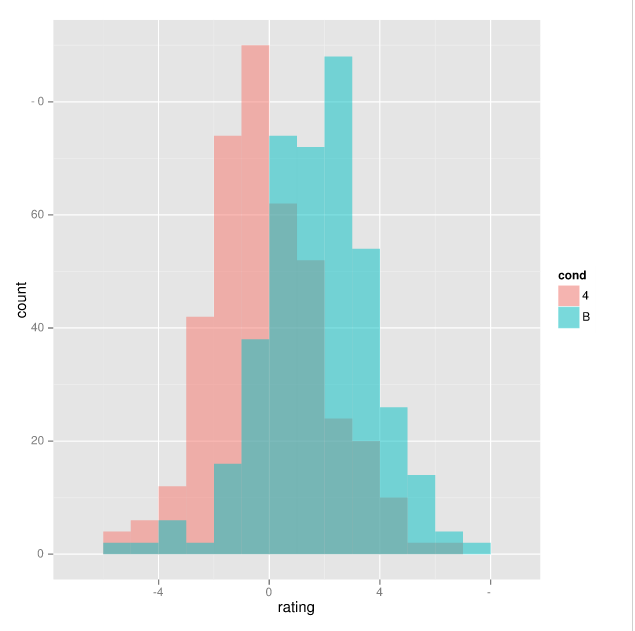
- # 疊加直方圖
- ggplot(dat, aes(x=rating, fill=cond)) +
- ? ? geom_histogram(binwidth=.5, alpha=.5, position="identity")
-
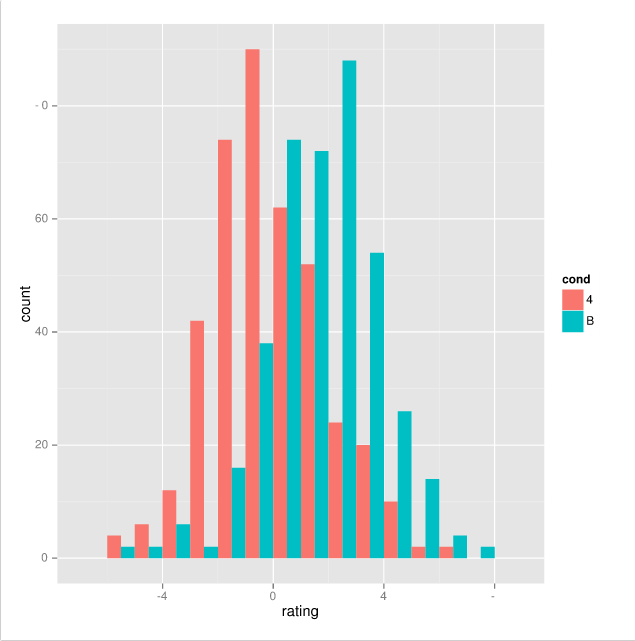
- # 交錯(cuò)直方圖
- ggplot(dat, aes(x=rating, fill=cond)) +
- ? ? geom_histogram(binwidth=.5, position="dodge")
-
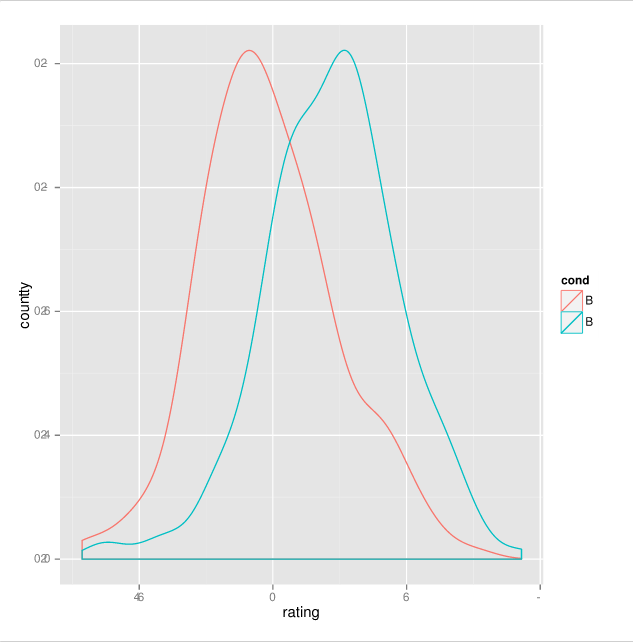
- # 密度圖
- ggplot(dat, aes(x=rating, colour=cond)) + geom_density()
-
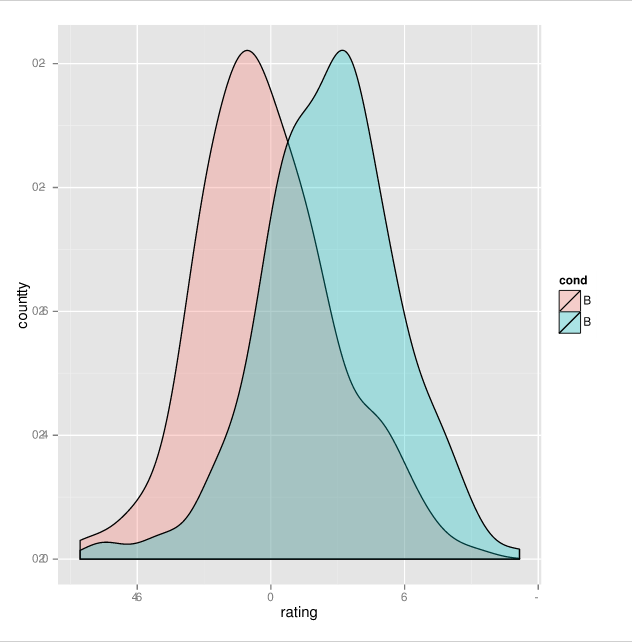
- # 帶半透明填充的密度圖
- ggplot(dat, aes(x=rating, fill=cond)) + geom_density(alpha=.3)


 0.0000
 0
0
 1
1

 關(guān)注作者
 收藏
收藏
評(píng)論(0)
 發(fā)表評(píng)論
暫無(wú)數(shù)據(jù)
CDA考試動(dòng)態(tài)
CDA報(bào)考指南
推薦帖子
0條評(píng)論
0條評(píng)論
0條評(píng)論
0條評(píng)論


